

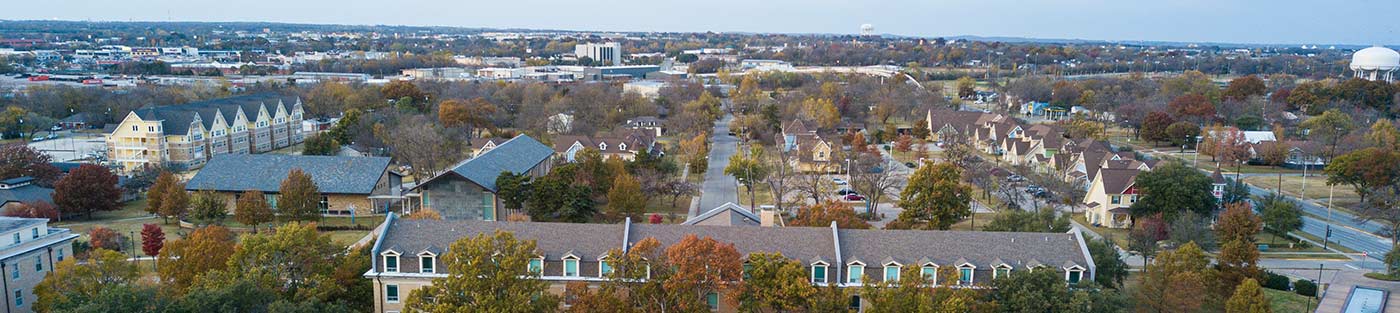
Sherman, TX
Population
Back To Top
Back To Top
Population
| Population | 2000 | 2010 | 2025 | 2030 |
|---|---|---|---|---|
| Sherman, TX | 35,629 | 39,058 | 46,950 | 51,460 |
Source: ESRI, 2025-09-30
Population by Age
| Population | 2025 |
|---|---|
| 0-4 | 2,990 |
| 5-9 | 3,072 |
| 10-14 | 2,971 |
| 15-19 | 3,355 |
| 20-24 | 3,310 |
| 25-29 | 3,459 |
| 30-34 | 3,239 |
| 35-39 | 3,083 |
| 40-44 | 2,907 |
| 45-49 | 2,514 |
| 50-54 | 2,536 |
| 55-59 | 2,399 |
| 60-64 | 2,621 |
| 65-69 | 2,586 |
| 70-74 | 2,191 |
| 75-79 | 1,669 |
| 80-84 | 1,075 |
| 85+ | 973 |
| 18+ | 36,138 |
| Median Age | 37 |
Source: ESRI, 2025-09-30
Population by Race
| Sherman, TX | 2025 |
|---|---|
| Total | 46,950.00 |
| White Alone | 58.37% |
| Black Alone | 10.71% |
| American Indian Alone | 1.7% |
| Asian Alone | 3.37% |
| Pacific Islander Alone | 0.07% |
| Some Other Race | 13.43% |
| Two or More Races | 12.34% |
| Hispanic Origin | 26.12% |
| Diversity Index | 76.20 |
Source: ESRI, 2025-09-30
Growth Rate
| Sherman, TX | 2025 - 2030 |
|---|---|
| Population | 1.85% |
| Households | 2.24% |
| Families | 2.17% |
| Median Household Income | 2% |
| Per Capita Income | 2% |
Source: ESRI, 2025-09-30
Housing
Back To Top
Households
| Population | 2000 | 2010 | 2025 | 2030 |
|---|---|---|---|---|
| Households | 13,931 | 15,015 | 18,419 | 20,574 |
| Housing Units | 15,126 | 16,629 | 20,210 | 22,593 |
| Owner Occupied Units | 9,724 | 10,506 | ||
| Renter Occupied Units | 8,695 | 10,068 | ||
| Vacant Units | 1,791 | 2,019 |
Source: ESRI, 2025-09-30
Home Value
| Sherman, TX | 2025 | 2030 |
|---|---|---|
| Median Home Value | $266,767 | $335,176 |
| Average Home Value | $308,986 | $392,352 |
| <$50,000 | 437 | 343 |
| $50,000 - $99,999 | 1,012 | 541 |
| $100,000 - $149,999 | 939 | 561 |
| $150,000 - $199,999 | 1,044 | 571 |
| $200,000 - $249,999 | 984 | 742 |
| $250,000 - $299,999 | 1,330 | 1,553 |
| $300,000 - $399,999 | 2,048 | 2,678 |
| $400,000 - $499,999 | 971 | 1,707 |
| $500,000 - $749,999 | 499 | 935 |
| $1,000,000 + | 195 | 389 |
Source: ESRI, 2025-09-30
Housing Year Built
| Year Range | Houses Built |
|---|---|
| 2010 or Later | 1,682 |
| 2000-2009 | 1,997 |
| 1990-1999 | 2,109 |
| 1980-1989 | 3,113 |
| 1970-1979 | 2,179 |
| 1960-1969 | 3,487 |
| 1950-1959 | 1,811 |
| 1940-1949 | 721 |
| 1939 or Before | 1,643 |
Source: ESRI, 2025-09-30
Back To TopIncome
Back To Top
Income
| Sherman, TX | 2025 | 2030 |
|---|---|---|
| Median Household | $57,851 | $65,141 |
| Average Household | $83,379 | $91,670 |
| Per Capita | $32,790 | $36,723 |
Source: ESRI, 2025-09-30
Household Income
| Sherman, TX | 2025 |
|---|---|
| <$15,000 | 1,212 |
| $15,000 - $24,999 | 1,215 |
| $25,000 - $34,999 | 1,612 |
| $35,000 - $49,999 | 3,625 |
| $50,000 - $74,999 | 3,540 |
| $75,000 - $99,999 | 2,055 |
| $100,000 - $149,999 | 2,930 |
| $150,000 - $199,999 | 985 |
| $200,000+ | 1,245 |
Source: ESRI, 2025-09-30
Back To TopEmployees
Back To Top
Commute
| Category | Commuters |
|---|---|
| Workers 16+ | 21,519 |
| In-County Residents | 17,576 |
| Out-of-County Residents | 3,388 |
| Drive Alone | 16,989 |
| Carpooled | 1,594 |
| Public Transport | 61 |
| Work at Home | 2,134 |
| Motorcycle | 11 |
| Bicycle | 21 |
| Walked | 368 |
| Other | 341 |
| Less than 5 minutes | 678 |
| 5-9 minutes | 3,522 |
| 10-14 minutes | 4,265 |
| 15-19 minutes | 3,604 |
| 20-24 minutes | 1,455 |
| 25-29 minutes | 765 |
| 30-34 minutes | 1,204 |
| 35-39 minutes | 409 |
| 40-44 minutes | 602 |
| 45-59 minutes | 981 |
| 60-89 minutes | 1,010 |
| 90+ minutes | 890 |
| Average Travel Time | 24 |
Source: ESRI, 2025-09-30
Source: ESRI, 2025-09-30
Employees by NAICS
| Category | Number |
|---|---|
| Total Employees | 28,577 |
| Agr/Forestry/Fish/Hunt | 4 |
| Mining | 45 |
| Utilities | 19 |
| Construction | 1,117 |
| Manufacturing | 2,823 |
| Wholesale Trade | 2,076 |
| Retail Trade | 5,062 |
| Motor Veh/Parts Dealers | 1,000 |
| Furn & Home Furnish Str | 114 |
| Electronics & Appl Store | 120 |
| Bldg Matl/Garden Equip | 430 |
| Food & Beverage Stores | 848 |
| Health/Pers Care Stores | 282 |
| Gasoline Stations | 137 |
| Clothing/Accessory Store | 240 |
| Sports/Hobby/Book/Music | 462 |
| General Merchandise Str | 1,429 |
| Transportation/Warehouse | 472 |
| Information | 583 |
| Finance & Insurance | 786 |
| Cntrl Bank/Crdt Intrmdtn | 497 |
| Sec/Cmdty Cntrct/Oth Inv | 98 |
| Insur/Funds/Trusts/Other | 191 |
| Real Estate/Rent/Leasing | 480 |
| Prof/Scientific/Tech Srv | 1,044 |
| Legal Services | 298 |
| Mgmt of Comp/Enterprises | 23 |
| Admin/Support/Waste Mgmt | 539 |
| Educational Services | 2,031 |
| HealthCare/Social Assist | 5,150 |
| Arts/Entertainment/Rec | 230 |
| Accommodation/Food Srvcs | 2,944 |
| Accommodation | 188 |
| Food Srv/Drinking Places | 2,756 |
| Other Srv excl Pub Admin | 1,347 |
| Auto Repair/Maintenance | 249 |
| Public Administration Emp | 1,794 |
Source: ESRI, 2025-09-30
Educational Attainment (25+)
| Sherman, TX | 2025 |
|---|---|
| <9th Grade | 1,041 |
| Some High School | 1,811 |
| GED | 1,807 |
| Graduated High School | 8,262 |
| Some College/No Degree | 7,021 |
| Associates Degree | 3,809 |
| Bachelor's Degree | 4,645 |
| Graduate Degree | 2,856 |
Source: ESRI, 2025-09-30
Back To TopBusinesses
Back To Top
Businesses by NAICS
| Category | Number |
|---|---|
| Total Businesses | 2,249 |
| Agr/Forestry/Fish/Hunt Bus | 2 |
| Mining Bus | 6 |
| Utilities Bus | 2 |
| Construction Bus | 127 |
| Manufacturing Bus | 69 |
| Wholesale Trade Bus | 69 |
| Retail Trade Bus | 351 |
| Motor Veh/Parts Dealers Bus | 54 |
| Furn & Home Furnish Str Bus | 15 |
| Electronics & Appl Store Bus | 6 |
| Bldg Matl/Garden Equip Bus | 30 |
| Food & Beverage Stores Bus | 53 |
| Health/Pers Care Stores Bus | 44 |
| Gasoline Stations Bus | 24 |
| Clothing/Accessory Store Bus | 43 |
| Sports/Hobby/Book/Music Bus | 44 |
| General Merchandise Str Bus | 38 |
| Transportation/Warehouse Bus | 31 |
| Information Bus | 48 |
| Finance & Insurance Bus | 131 |
| Cntrl Bank/Crdt Intrmdtn Bus | 56 |
| Sec/Cmdty Cntrct/Oth Inv Bus | 23 |
| Insur/Funds/Trusts/Other Bus | 52 |
| Real Estate/Rent/Leasing Bus | 104 |
| Prof/Scientific/Tech Srv Bus | 180 |
| Legal Services Bus | 72 |
| Mgmt of Comp/Enterprises Bus | 5 |
| Admin/Support/Waste Mgmt Bus | 62 |
| Educational Services Bus | 44 |
| HealthCare/Social Assist Bus | 317 |
| Arts/Entertainment/Rec Bus | 36 |
| Accommodation/Food Srvcs Bus | 174 |
| Accommodation Bus | 17 |
| Food Srv/Drinking Places Bus | 157 |
| Other Srv excl Pub Admin Bus | 286 |
| Auto Repair/Maintenance Bus | 50 |
| Public Administration Bus | 102 |
Source: ESRI, 2025-09-30
Back To Top